
In the realm of cleanroom environments, the process becomes the product. If you don’t have control over your process, you don’t have control over your product. Environmental monitoring of cleanrooms incorporates real-time data acquisition, analysis, and reporting to support validation and ongoing compliance efforts – protecting your valuable scientific work and reducing process variability.
Revised: April 22nd, 2024
Protecting Cleanrooms with Environmental Monitoring
Cleanrooms, also referred to as “clean zones” are built to meet precise industry requirements. A cleanroom for a biotechnology company focused on genetic testing will have different parameters than one for a pharmaceutical or a semiconductor company.
Luckily for most industries, standards such as the International Standards Organization (ISO) are established and need only be adhered to. The real task lies in maintaining compliance:
- How can you guarantee that your cleanrooms meet these standards consistently, thoroughly, and without fail?
- With standards and regulations constantly evolving, how do you stay ahead?
- How can your business move forward if you’re constantly looking over your shoulder to ensure compliance?
The answer is automation.
By implementing an automated Environmental Monitoring System (EMS), users don’t have to worry about the state of their cleanrooms. An EMS has built-in reporting mechanisms to help facilities stay compliant and reduce process variability related to manual tasks.
Before dissecting automation tools and tactics, we’ll take a closer look at classifications and validation parameters.
Cleanroom Validation
Validation helps ensure cleanrooms meet specific ISO standards. Such standards regulate degrees of cleanliness and are defined by factors such as particle count and size, air change rates, and more parameters outlined in ISO 14644-1. These classifications also help ensure the integrity of products that may be contained in a cleanroom.
The validation process naturally requires inspection and testing, but also means that cleanrooms must perform ongoing monitoring to demonstrate continued compliance (as these standards are never “one and done” and require everyday check-ins).
Cleanroom Validation Parameters
Cleanroom ISO Classes (1-9) are based on air cleanliness by particle concentration, with specific maximum allowable concentrations (particles/m3) for particles from 0.1 to 5 µm. Particle counts must be performed in accordance with ISO 14644-1, and must be repeated periodically to demonstrate ongoing compliance.
If you’ve worked in a controlled environment, then you can agree that “periodically” is not a scientific milestone. A myriad of things can go wrong during the built-in time gaps. For a multitude of reasons, air cleanliness can shift moments after a count, samples may be compromised, and tests could fail.
This is precisely why when it comes to monitoring particle counts, most facilities opt for 24/7 real-time monitoring instead of periodic “check-ins.” Look at it this way: A periodic check-in is akin to using an at-home COVID test. The test is only able to collect the data for that single point in time, and the results might not hold true even moments later.
Particle counts are only the tip of the iceberg: there are a plethora of tests and parameters outlined in ISO standards that could impact daily compliance in your cleanroom(s). For instance, tests for:
- Ultrafine airborne particles
- Macroparticles
- Airflow
- Air pressure difference
- Temperature
- Humidity
Thankfully, most parameters can be incorporated into a monitoring program that can ensure a more controlled cleanroom environment.
Relative Humidity vs. Absolute Humidity
To understand Relative Humidity (RH), we must first speak about Absolute Humidity.
Absolute Humidity
Absolute humidity measures the amount of water vapor in the air, regardless of the air's temperature. Even as changes in the temperature of the measured environment occur, absolute humidity stays the same (so long as the moisture content of the air remains unchanged).
Relative Humidity
Relative humidity is expressed as a percentage and measures the amount of water vapor present in the air relative to the maximum amount the air can hold at a given temperature. In other words, relative humidity indicates how close the air is to being fully saturated with vapor at that temperature.
Since warm air holds more moisture than cold air, the relative humidity level will decrease as the air temperature increases –even if absolute humidity stays the same. Conversely, the relative humidity level will increase as air temperature decreases since colder (and therefore denser) air cannot hold as much water.
The graphs below illustrate the interplay between temperature and relative humidity.
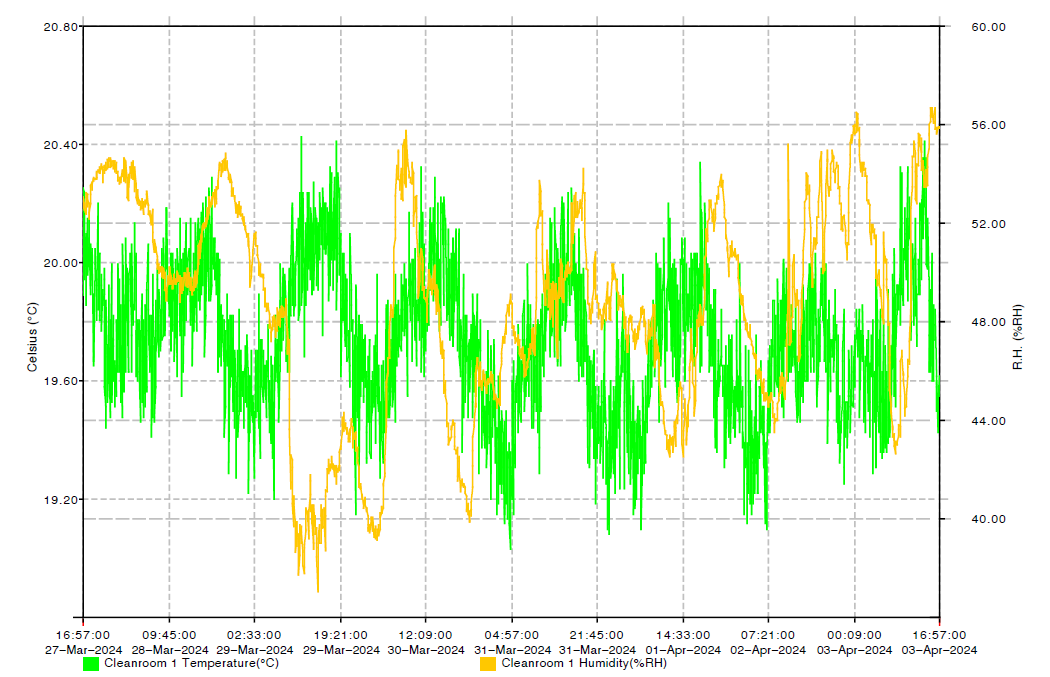
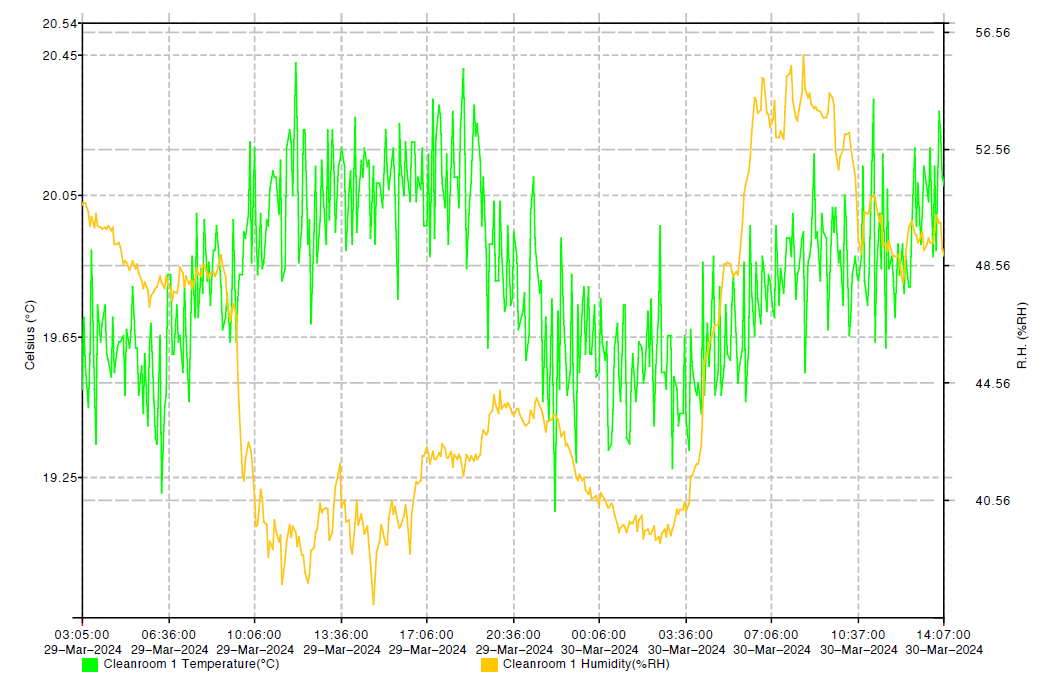
We can assume that periodic increases and decreases in room temperature are related to the cycling “on/off” of an air conditioner or heater. Where we see peaks and valleys at room temperature, we alternately see valleys and peaks in the relative humidity.
In instances where the graph does not show an expected inverse relationship between temperature and relative humidity, other factors could be at play. A change in humidity could be affecting the temperature (instead of the other way around). When observed this way, there might be a lag time between cause and effect. Other reasons could be related to air being introduced from outside the room or sunlight shining directly at or near a probe. It should also be noted that a decrease in air pressure can result in a decrease in relative humidity, and vice-versa.
Proper Probe Placement & Best Practices
Relative Humidity and Temperature (RH&T) sensors should never be placed in proximity to equipment that could affect readings such as HVAC duct vents, humidifiers, cooling or heating coils, blowers, incubator doors, sources of water, other sensors, aerosols, etc.
Another interesting consideration: with cheaper RH&T sensors, the internal electronics heating up inside their housing can affect the temperature of the probe and negatively affect readings.
The Case for Proactive Cleanroom Environmental Monitoring
Is ISO enough for a cleanroom?
Let’s assess airborne particle count in relation to ISO standards. Despite the detailed test procedures that specify the number of sample points, sampling locations, apparatuses, and data required for reporting according to ISO 14644-1, users are only getting a snapshot of the cleanroom environment. Without continuous data for particle count and other critical parameters, it is impossible to identify abnormalities that can impact samples and products.
Challenges also arise when clean rooms rely on multiple monitoring devices and platforms to obtain a complete understanding of the cleanroom environment. Not only might these devices be “speaking different languages” (making it difficult to evaluate parameters concurrently) but manually compiling data from different platforms is time-consuming, costly, and prone to error.
What Can Happen if a Cleanroom is Not Monitored?
- Contamination risk
- Compromise sample integrity
- Legal penalties/ operational shutdowns
- Delays issue detection
- Skewed experimental results
- Unreliable data
- Setbacks in drug development
- Product recalls
- Health risks
- Waste of resources
- If there’s a disaster, you have to restore the cleanroom environment
The most effective means of cleanroom environmental monitoring comes down to the software, hardware, and service – that’s where XiltriX comes in.
The Solution for Proactive Laboratory Cleanroom Monitoring
The XiltriX system is designed to provide reliable monitoring of your facility’s numerous parameters in a single solution.
XiltriX integrates data collection from an array of sensors, assets, and equipment, offering comprehensive data analysis, reporting, and documentation. It delivers real-time insights on various parameters critical to both research and product integrity.
In addition to particle counting, our Monitoring-as-a-Service solution can measure temperature, relative humidity, differential air pressure, VOCs (volatile organic compounds), gases, light intensity, vibration, and additional parameters that provide valuable insight into the cleanroom environment.
Within highly controlled cleanroom environments, fluctuations in critical parameters can have significant consequences for the experiments and products contained within. XiltriX provides data acquisition, analysis, and reporting on all equipment and environmental parameters to ensure optimal cleanroom environments.
XiltriX provides a comprehensive validation support packet that includes Installation Qualification (IQ), Operational Qualification (OQ), and Performance Qualification (PQ) documentation and built-in reports. This enhances and simplifies ongoing testing, ensuring adherence to stringent standards and regulations.
If you’re interested in learning more about the environmental monitoring of cleanrooms and how XiltriX can help, download our white paper on "Critical Parameters for Cleanroom Monitoring."
